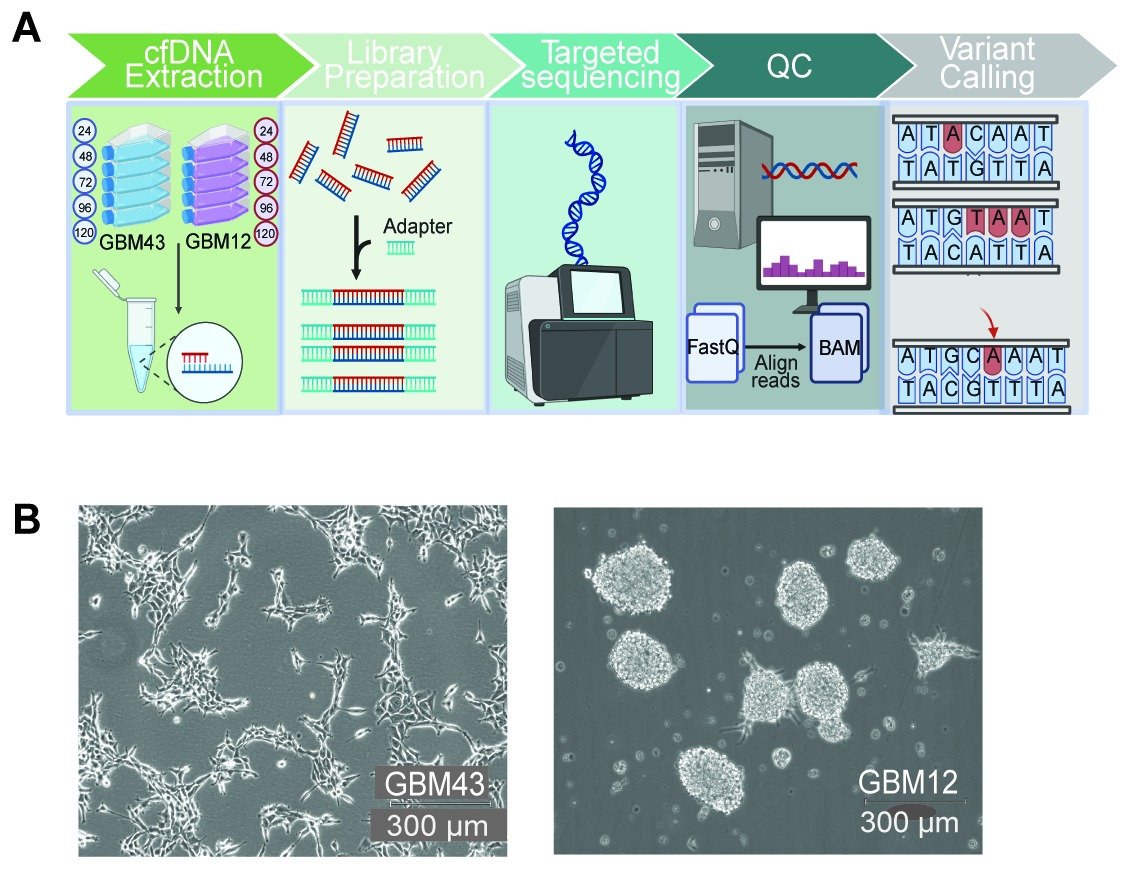
Top: a five-step workflow schematic: cfDNA extraction from GBM43 and GBM12 cultures sampled at 24, 48, 72, 96 and 120 hours, library preparation, targeted sequencing, quality control, and variant calling. Bottom: brightfield micrographs of the two patient-derived glioblastoma lines. GBM43 grows as adherent, spindle-shaped cells and GBM12 as rounded neurospheres (scale bars 300 µm).

Glioblastoma is monitored mostly by MRI, which can miss early changes in tumor burden. Cell-free DNA (cfDNA) in blood is a promising alternative, but we know little about what governs its release. In our new paper in Neuro-Oncology, led by Sharvari Mankame, we dissect cfDNA release in patient-derived glioblastoma models under tightly controlled conditions.

We cultured two patient-derived lines from the Mayo Clinic GBM PDX National Resource, GBM43 and GBM12, and sampled the conditioned media every 24 hours for five days to measure cell counts, cfDNA yield, fragment size and variants by targeted sequencing. All variants in each line’s genomic DNA were detected in its cfDNA. In GBM43 their allele frequencies rose over the five days, while in GBM12 they stayed stable.
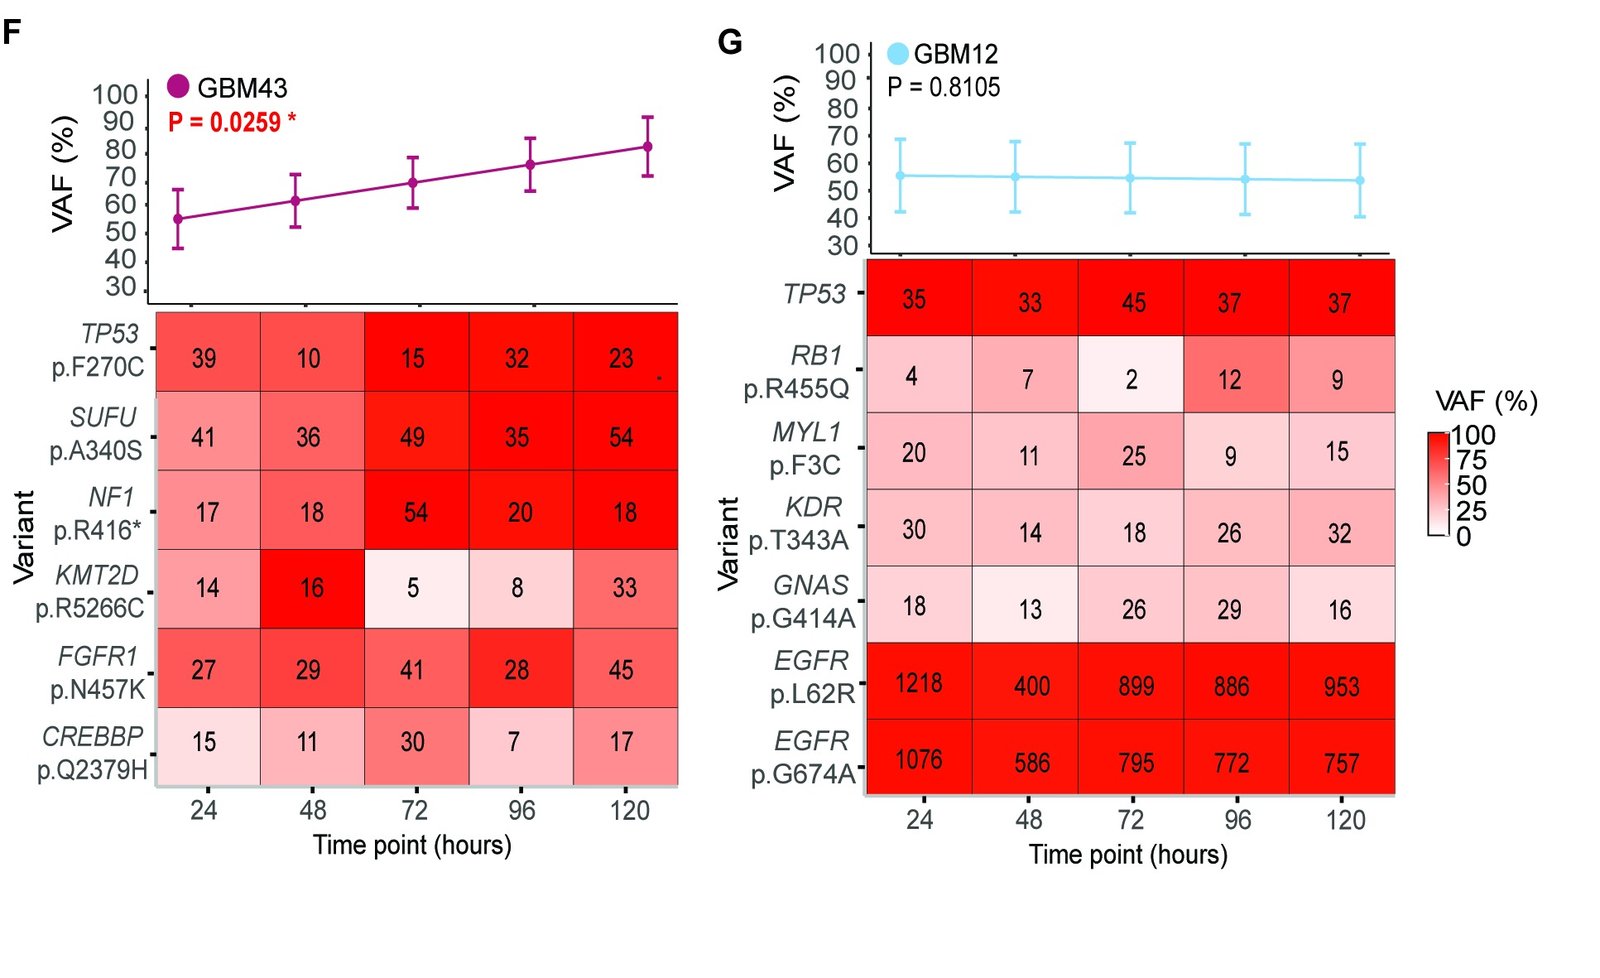
Two panels of variant allele frequency (VAF) in cfDNA over five days. Left, GBM43: mean VAF rises from about 55% at 24 hours to about 80% at 120 hours (P = 0.026), above a heatmap of six GBM43 variants including TP53, SUFU and NF1. Right, GBM12: mean VAF stays near 55% at all timepoints (P = 0.81), above a heatmap of seven GBM12 variants including two in EGFR. Heatmap cells show supporting read counts.
Variant allele frequencies in cfDNA over five days, rising in GBM43 (left) and stable in GBM12 (right). Heatmap cells show supporting read counts.

We expected cfDNA to come mostly from dying cells. Instead, cfDNA yield correlated more strongly with live cell counts than with dead cell counts (GBM43: R = 0.88 versus 0.47). Release in these models is therefore not driven by apoptosis alone.
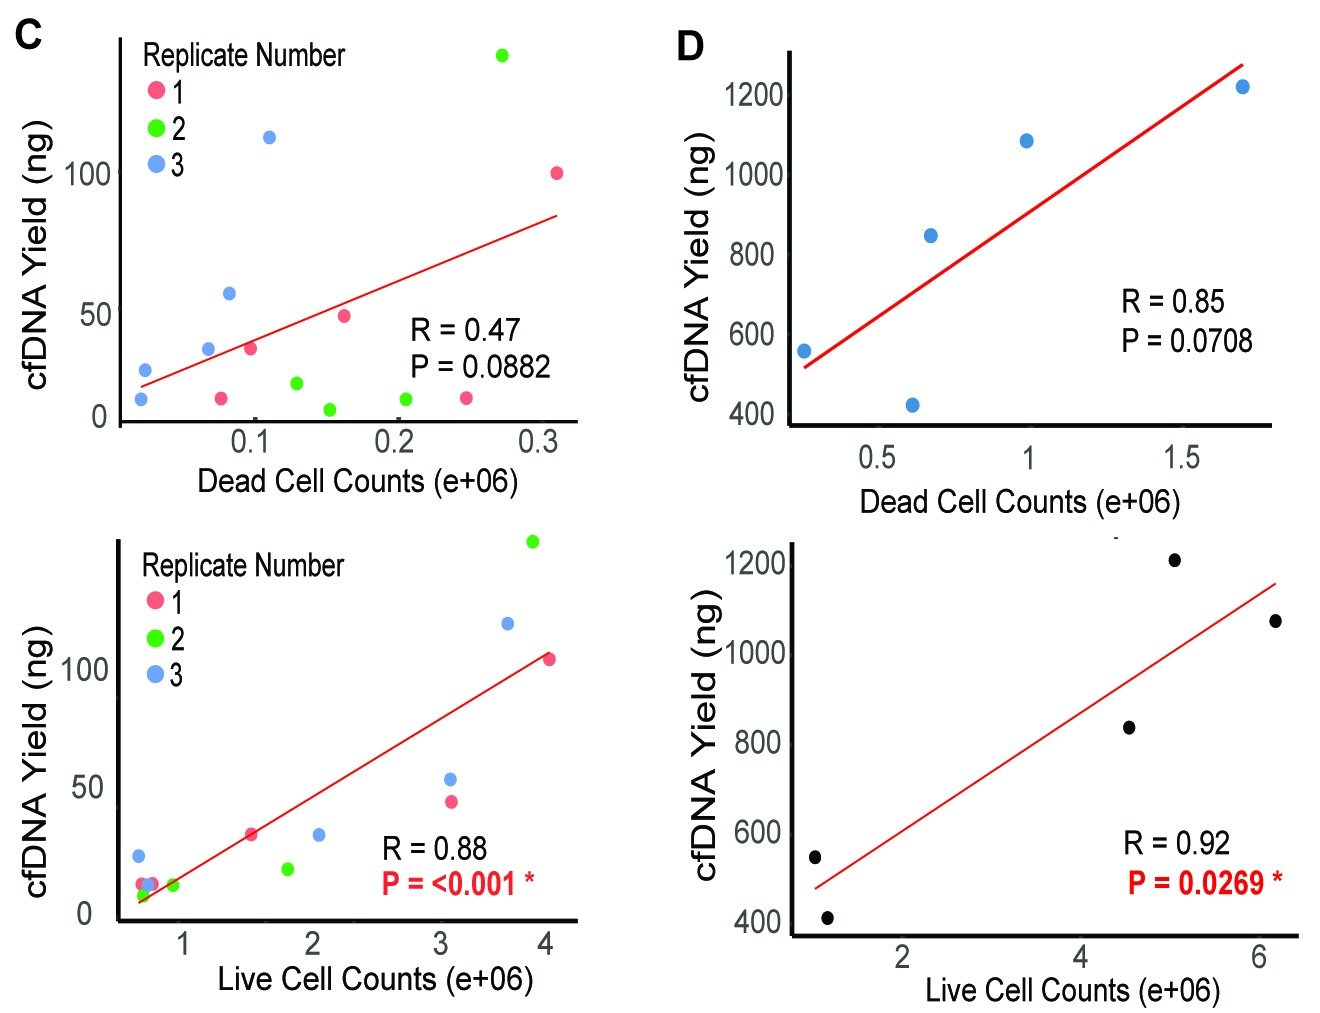
Four scatter plots of cfDNA yield against cell counts. GBM43, left: yield correlates weakly with dead cell counts (R = 0.47, P = 0.088) and strongly with live cell counts (R = 0.88, P < 0.001), with points colored by replicate. GBM12, right: yield correlates with dead cell counts (R = 0.85, P = 0.071, not significant) and with live cell counts (R = 0.92, P = 0.027).
cfDNA yield against dead (top) and live (bottom) cell counts for GBM43 (left) and GBM12 (right).

To model the tumor microenvironment, we co-cultured GBM43 with normal human astrocytes (NHAs). Variants unique to each cell type let us attribute cfDNA to its source: GBM43 variants were absent from astrocyte cfDNA, and astrocyte variants were absent from tumor cfDNA.
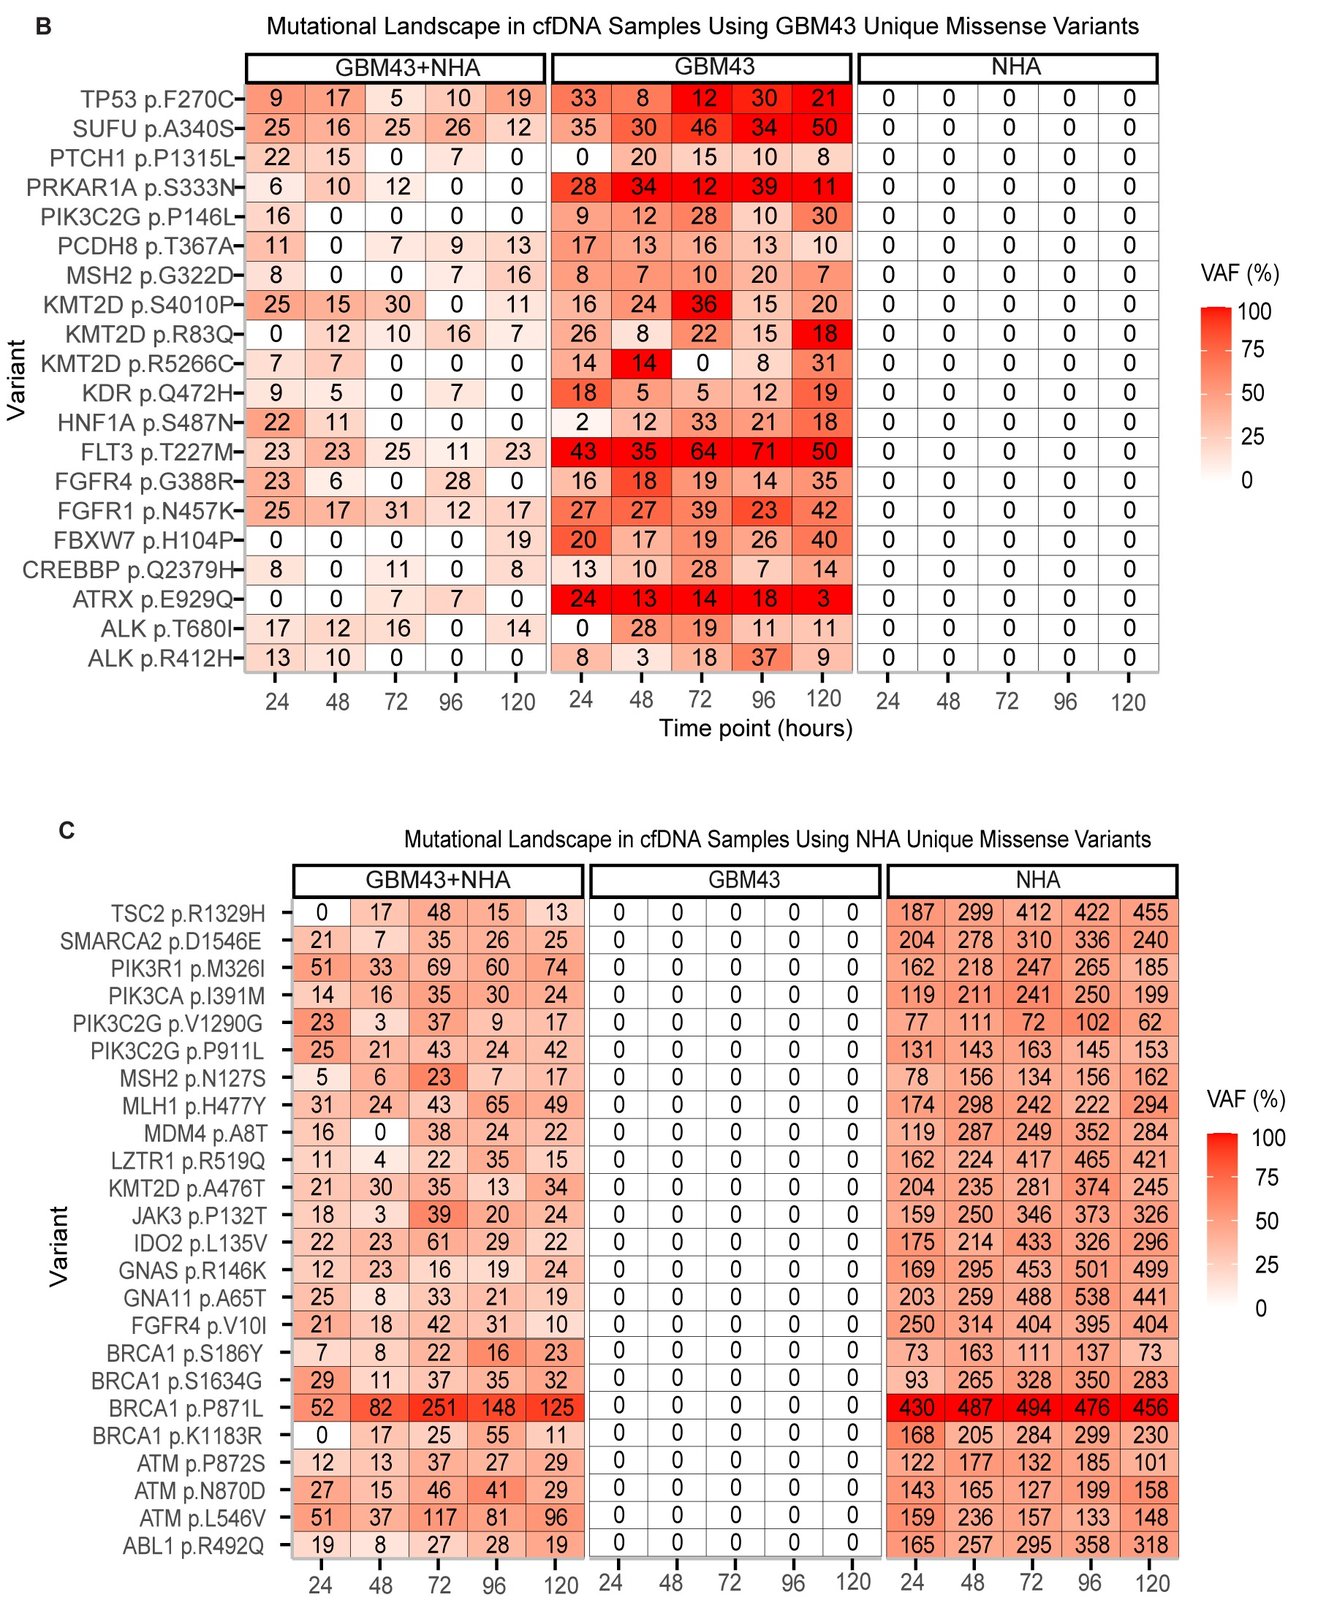
Two heatmaps of variant allele frequency in cfDNA from GBM43 plus astrocyte co-culture, GBM43 monoculture and astrocyte (NHA) monoculture, each at 24 to 120 hours. Top: variants unique to GBM43 appear in GBM43 and co-culture cfDNA and are absent from NHA cfDNA. Bottom: variants unique to NHA appear in NHA and co-culture cfDNA and are absent from GBM43 cfDNA. Cells show supporting read counts.
GBM43-unique (top) and NHA-unique (bottom) variants across co-culture, GBM43 and NHA cfDNA. Each cell type's variants are absent from the other's cfDNA.

Over five days, GBM43 outgrew the astrocytes and astrocyte death increased. In co-culture cfDNA, NHA-specific allele frequencies rose 2.4% per day while GBM43-specific allele frequencies fell 3.6% per day. DNA from dying astrocytes diluted the tumor signal, much as DNA from non-malignant cells dilutes tumor DNA in patient plasma.
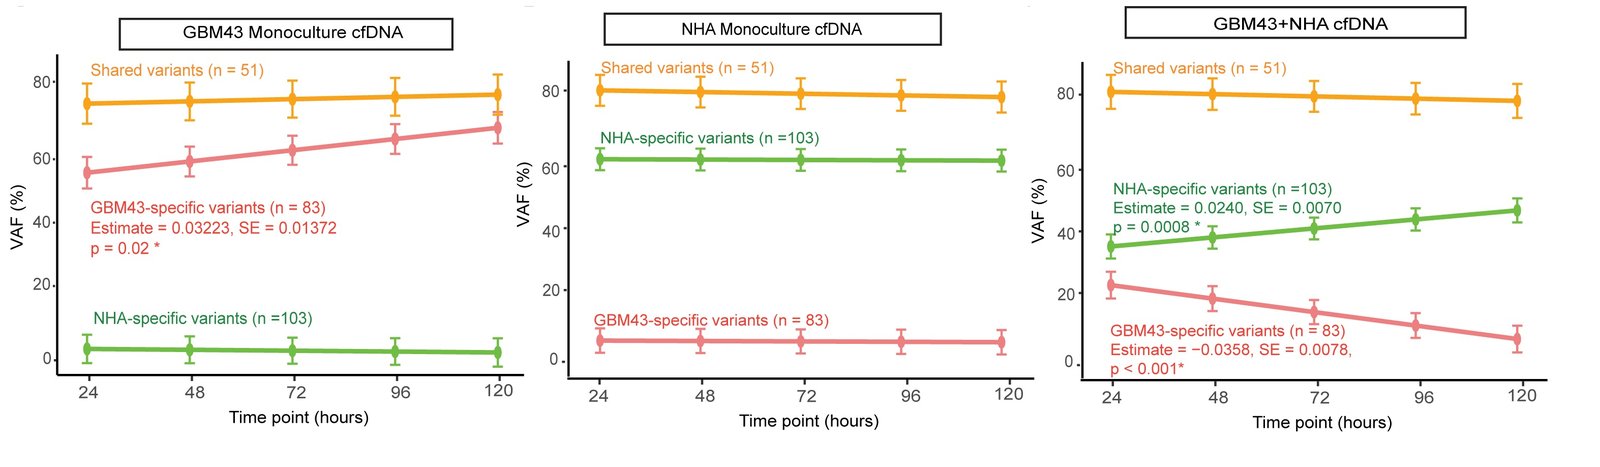
Three line graphs of mean VAF from 24 to 120 hours for shared, GBM43-specific and NHA-specific variants. In GBM43 monoculture cfDNA, GBM43-specific VAF rises (P = 0.02). In NHA monoculture cfDNA, VAFs stay flat. In co-culture cfDNA, NHA-specific VAF rises from about 35% to about 47% (P = 0.0008) while GBM43-specific VAF falls from about 23% to about 7% (P < 0.001). Shared variants stay near 80% throughout.
Mean VAF of shared, GBM43-specific and NHA-specific variants in GBM43 monoculture, NHA monoculture and co-culture cfDNA. In co-culture, NHA-specific VAFs rise as GBM43-specific VAFs fall.

Fragment sizes told the same story. Astrocyte cfDNA showed a mononucleosomal peak (~185 bp) typical of apoptosis, GBM43 cfDNA lacked nucleosomal peaks, and co-cultures produced a multimodal pattern (174, 330 and 486 bp) seen in neither monoculture.
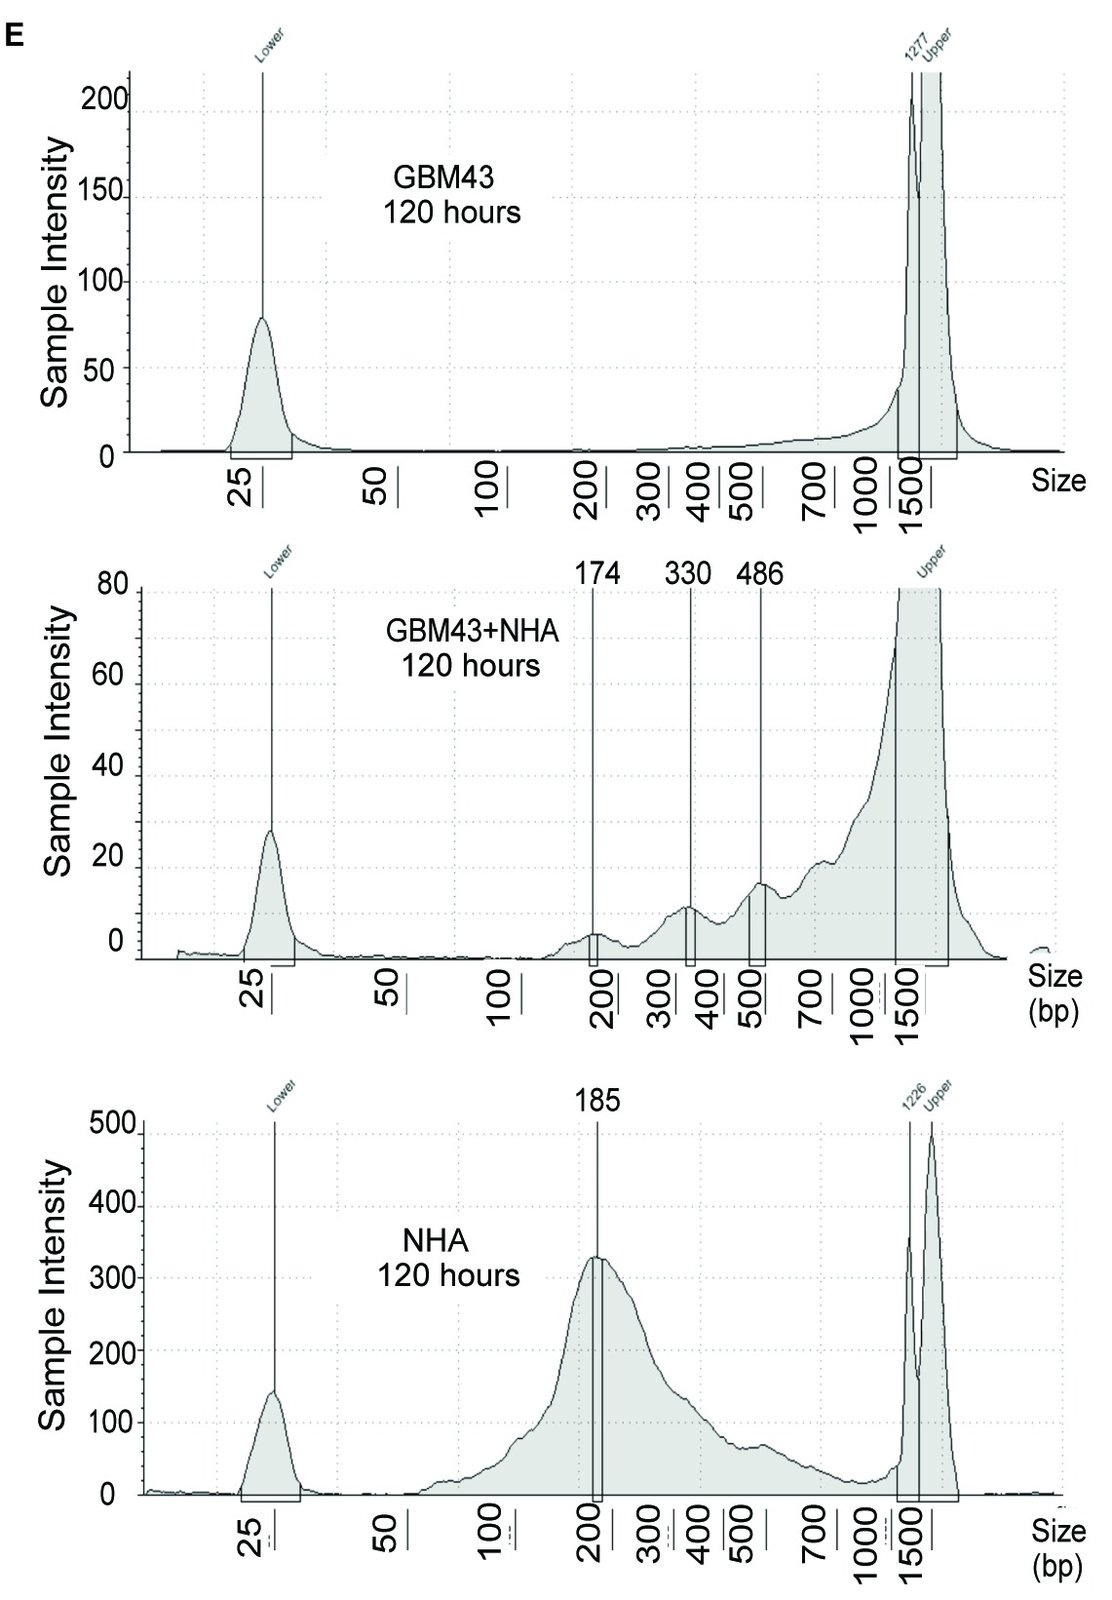
Three TapeStation electropherograms of cfDNA fragment size at 120 hours. GBM43 monoculture shows no nucleosomal peaks, with signal concentrated in long fragments. GBM43 plus astrocyte co-culture shows a multimodal pattern with peaks at 174, 330 and 486 bp. Astrocyte (NHA) monoculture shows a dominant mononucleosomal peak at 185 bp.
cfDNA fragment size profiles at 120 hours for GBM43 monoculture (top), co-culture (middle) and NHA monoculture (bottom).

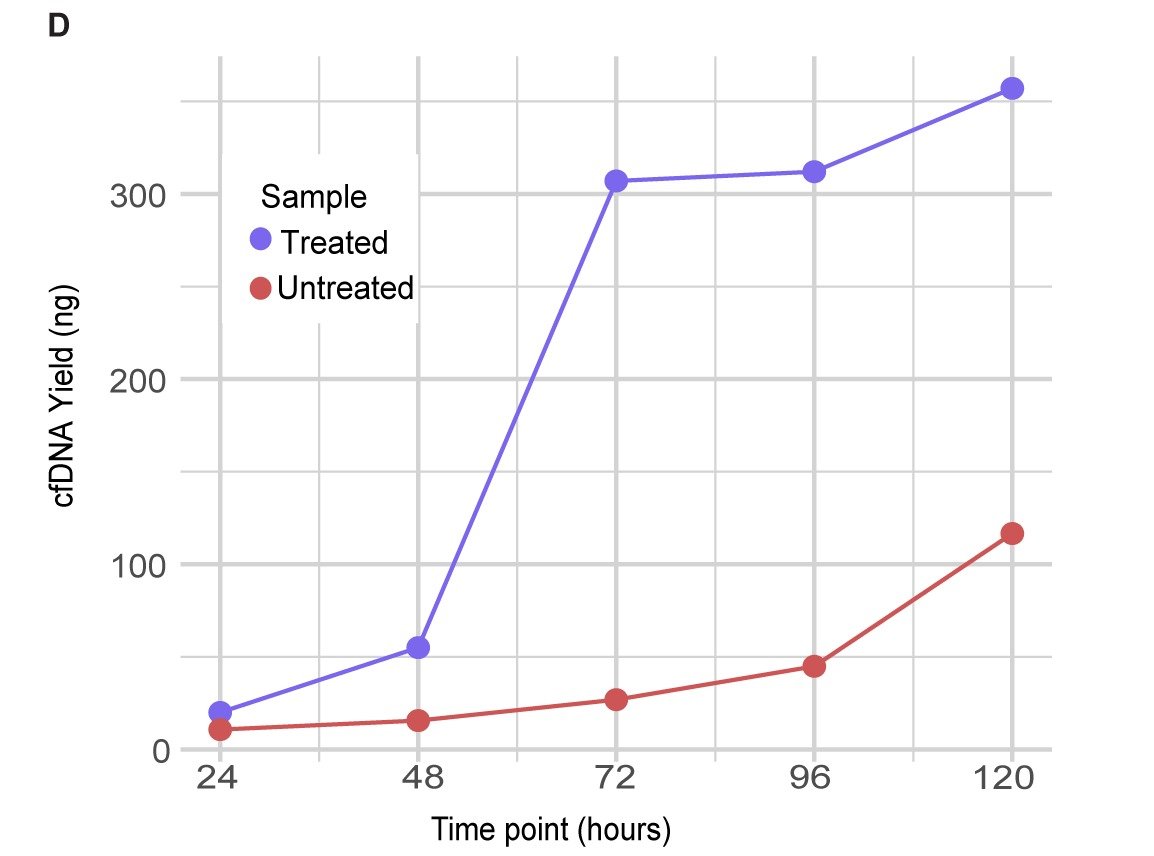
Temozolomide (TMZ) changed the picture. In treated GBM43 cultures, cfDNA yield rose sharply and correlated with dead cell counts (R = 0.85), no longer with live cell counts (R = −0.04). Treated cfDNA also showed nucleosomal laddering and a narrower pool of detectable variants.
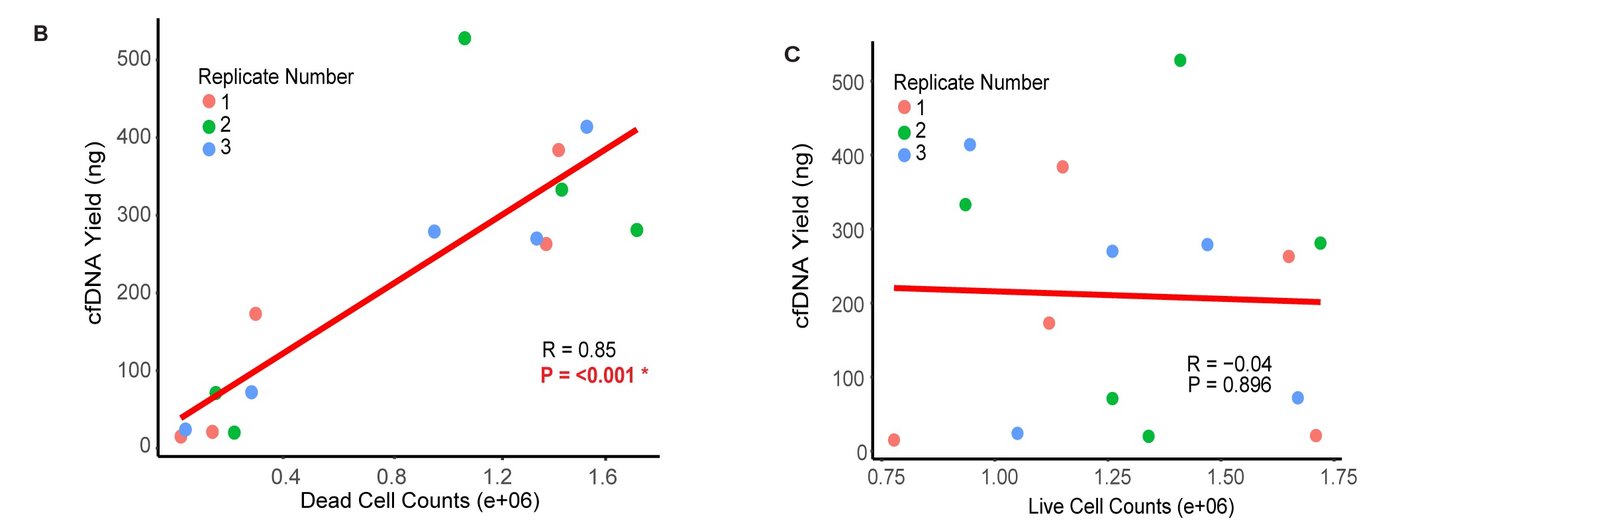
Two scatter plots for temozolomide-treated GBM43 cultures, with points colored by replicate. cfDNA yield correlates strongly with dead cell counts (R = 0.85, P < 0.001) and does not correlate with live cell counts (R = −0.04, P = 0.896).
In TMZ-treated GBM43, cfDNA yield correlates with dead cell counts (left) and not with live cell counts (right).
Line graph of cfDNA yield from 24 to 120 hours. Temozolomide-treated GBM43 cultures rise sharply after 48 hours to about 350 ng at 120 hours. Untreated cultures increase gradually to about 120 ng.
cfDNA yield over five days in TMZ-treated and untreated GBM43 cultures.

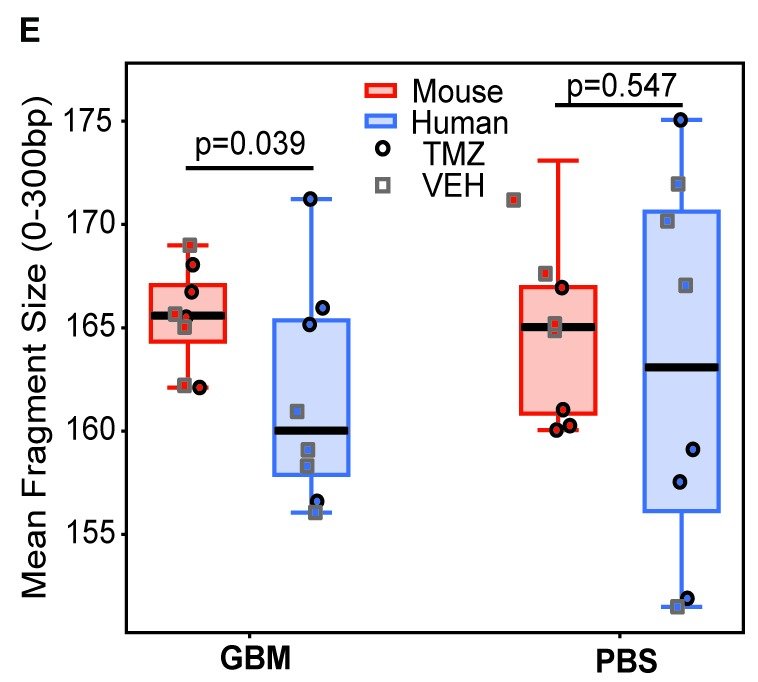
Finally, we turned to mice carrying orthotopic GBM43 tumors, treated with TMZ or vehicle. Plasma cfDNA was elevated in tumor-bearing mice relative to PBS-injected controls. After separating human from mouse reads, we found that tumor-derived fragments were shorter than host fragments, and that their copy number profile recapitulated the chromosome 7 and 9 gains of the parental cells.
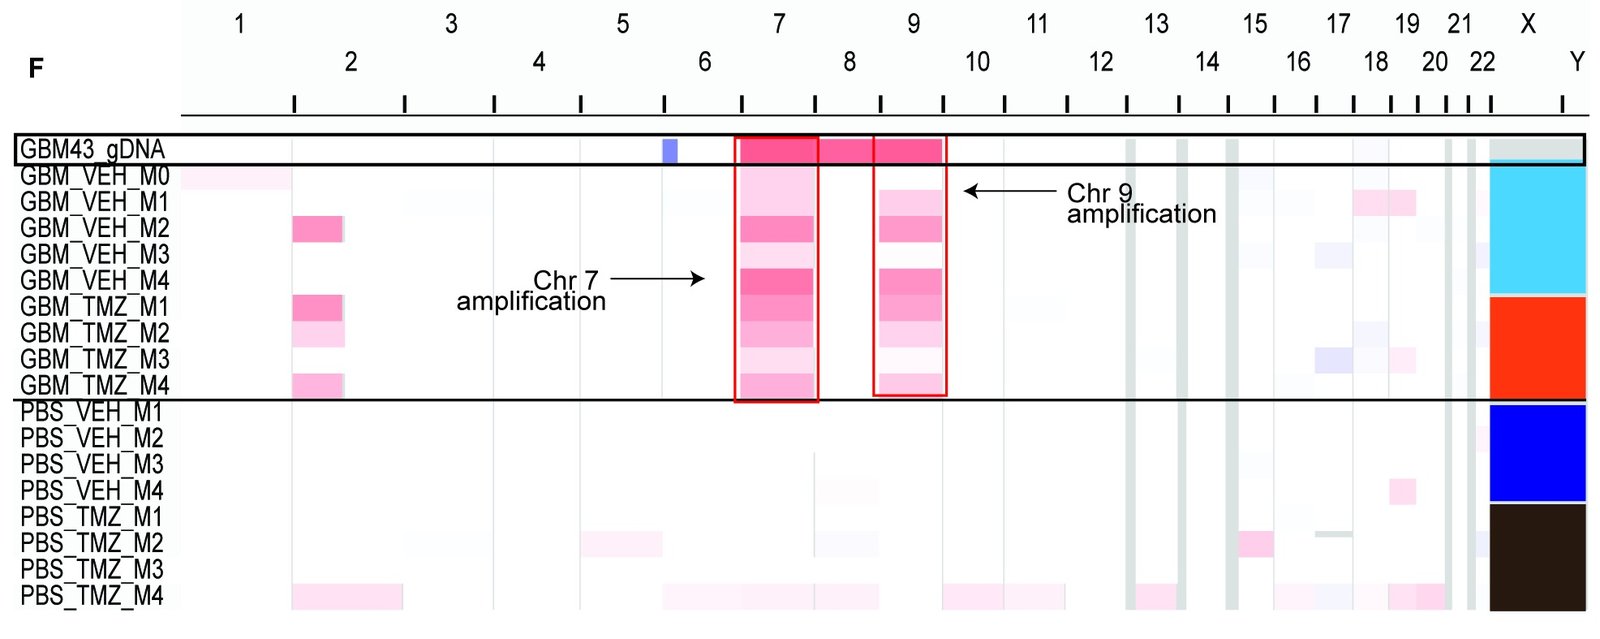
Genome-wide copy number heatmap with chromosomes 1 to 22, X and Y along the top. The first row, GBM43 genomic DNA, shows gains of chromosomes 7, 8 and 9. Plasma cfDNA from GBM43 tumor-bearing mice, treated with vehicle or temozolomide, shows matching gains of chromosomes 7 and 9, outlined in red. Plasma from PBS-injected control mice shows no such gains.
Copy number profiles of GBM43 genomic DNA and of human-derived plasma cfDNA from tumor-bearing (GBM) and control (PBS) mice. Chromosome 7 and 9 gains are outlined in red.
Box plots of mean cfDNA fragment size (0 to 300 bp) for mouse-derived (red) and human-derived (blue) reads. In tumor-bearing mice, human fragments are shorter than mouse fragments (P = 0.039). In PBS-injected control mice, the difference is not significant (P = 0.547).
Mean fragment size of mouse-derived and human-derived cfDNA in tumor-bearing (GBM) and control (PBS) mice.

Together: cfDNA composition depends on tumor proliferation, the microenvironment and treatment. Interpreting a liquid biopsy in glioblastoma will require accounting for that context, and our next step is to test these principles in patient samples.

Getting the patient-derived cultures to grow reliably took two years, and each experiment was run in triplicate. Huge credit to Sharvari for leading this work, to Hersh Nanda, Maria Kyriakidou and Mimi Mbegbu from our lab, to Nanyun Tang and Michael Berens at TGen, and to Angad Beniwal, Matthew Dufault and Nhan Tran, who ran the mouse studies at Mayo Clinic Arizona. This research was supported by a 2022 American Brain Tumor Association Discovery Award, the Ivy Foundation, the Lane Spyrow GBM Fellowship and Students Supporting Brain Tumor Research.

Read more: the paper in Neuro-Oncology · the preprint on bioRxiv

Social media link: BlueSky · Twitter