Children with brain tumors are monitored mostly by MRI, and a scan cannot always show early enough that a tumor is growing back. Circulating tumor DNA (ctDNA) is the small fraction of cell-free DNA (cfDNA) in blood and cerebrospinal fluid (CSF) that comes from the tumor. It could add a molecular readout, but pediatric brain tumors shed little of it, and laboratories define a positive sample in different ways. In our new preprint with colleagues at Phoenix Children’s, led by Shea Gallus and Sharvari Mankame, we combine three ways of detecting ctDNA into one score.
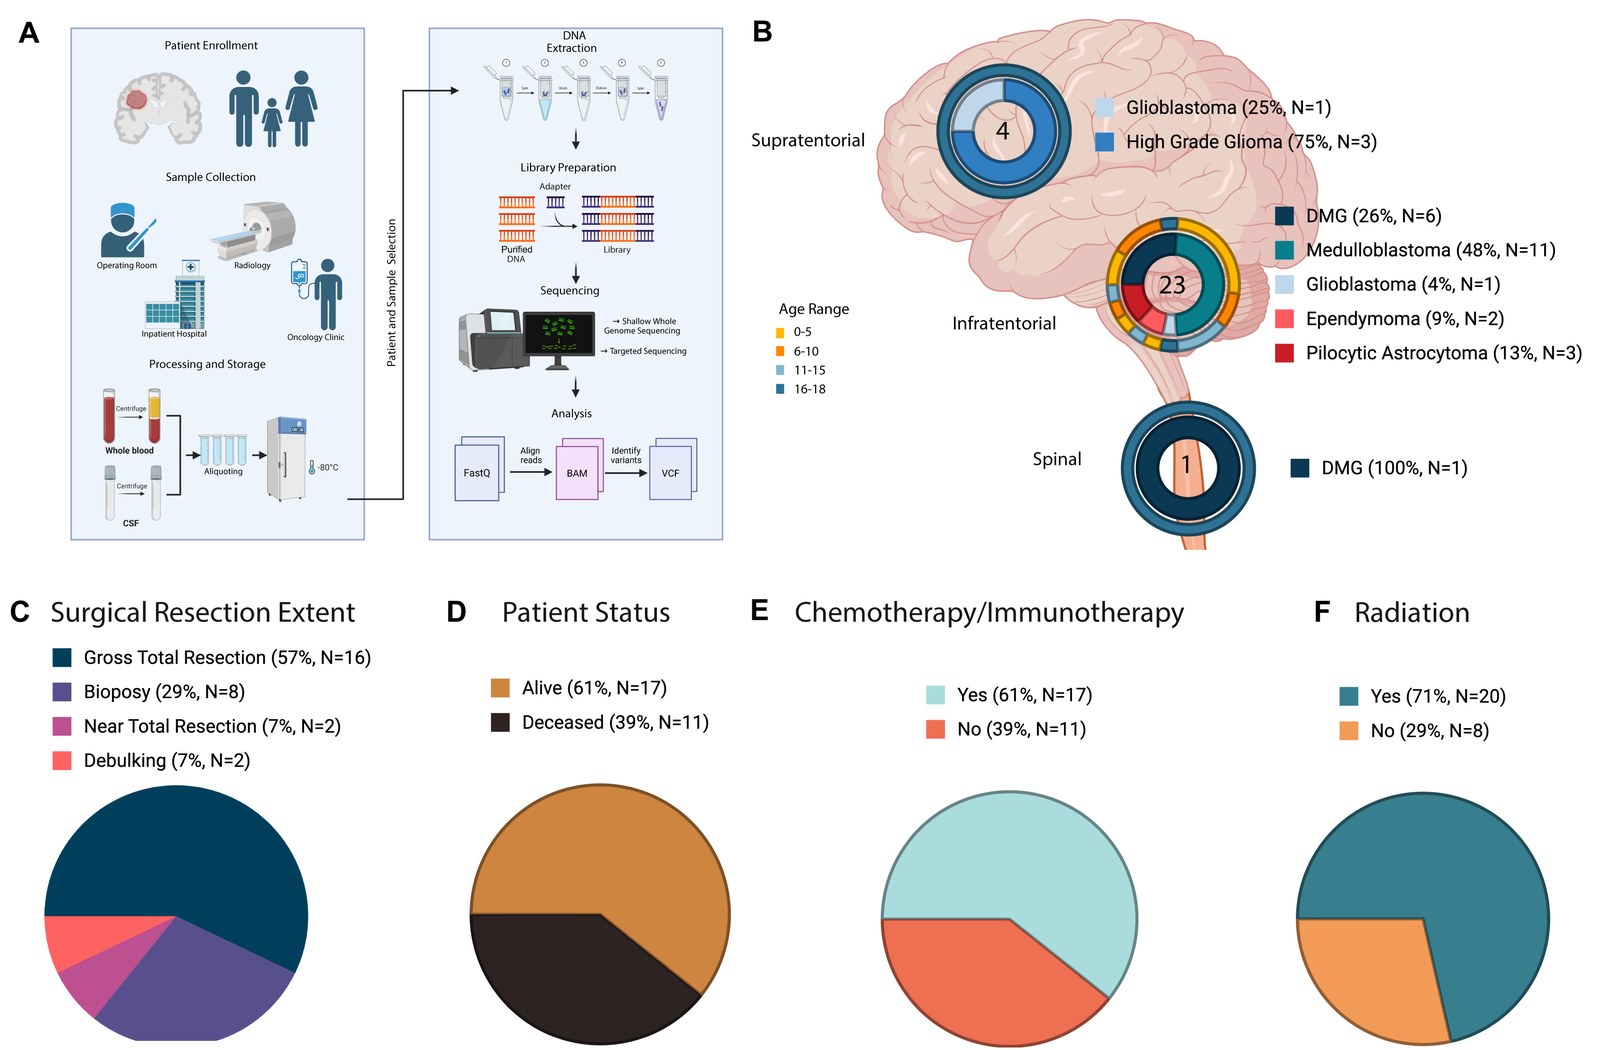
We followed 28 children with medulloblastoma, diffuse midline glioma, high-grade glioma, pilocytic astrocytoma or ependymoma. The clinical team collected 140 plasma and 27 CSF samples during clinic visits, MRI appointments and surgery, alongside each child’s routine care.
We sequenced each tumor, each matched germline sample and each cfDNA sample. Each cfDNA sample then received a score from three readouts: tumor-informed mutations from targeted sequencing, copy number tumor fraction from shallow whole genome sequencing, and the ratio of short to long cfDNA fragments. We set each threshold using the matched germline samples, and we call a sample ctDNA-positive when the composite score reaches 2.
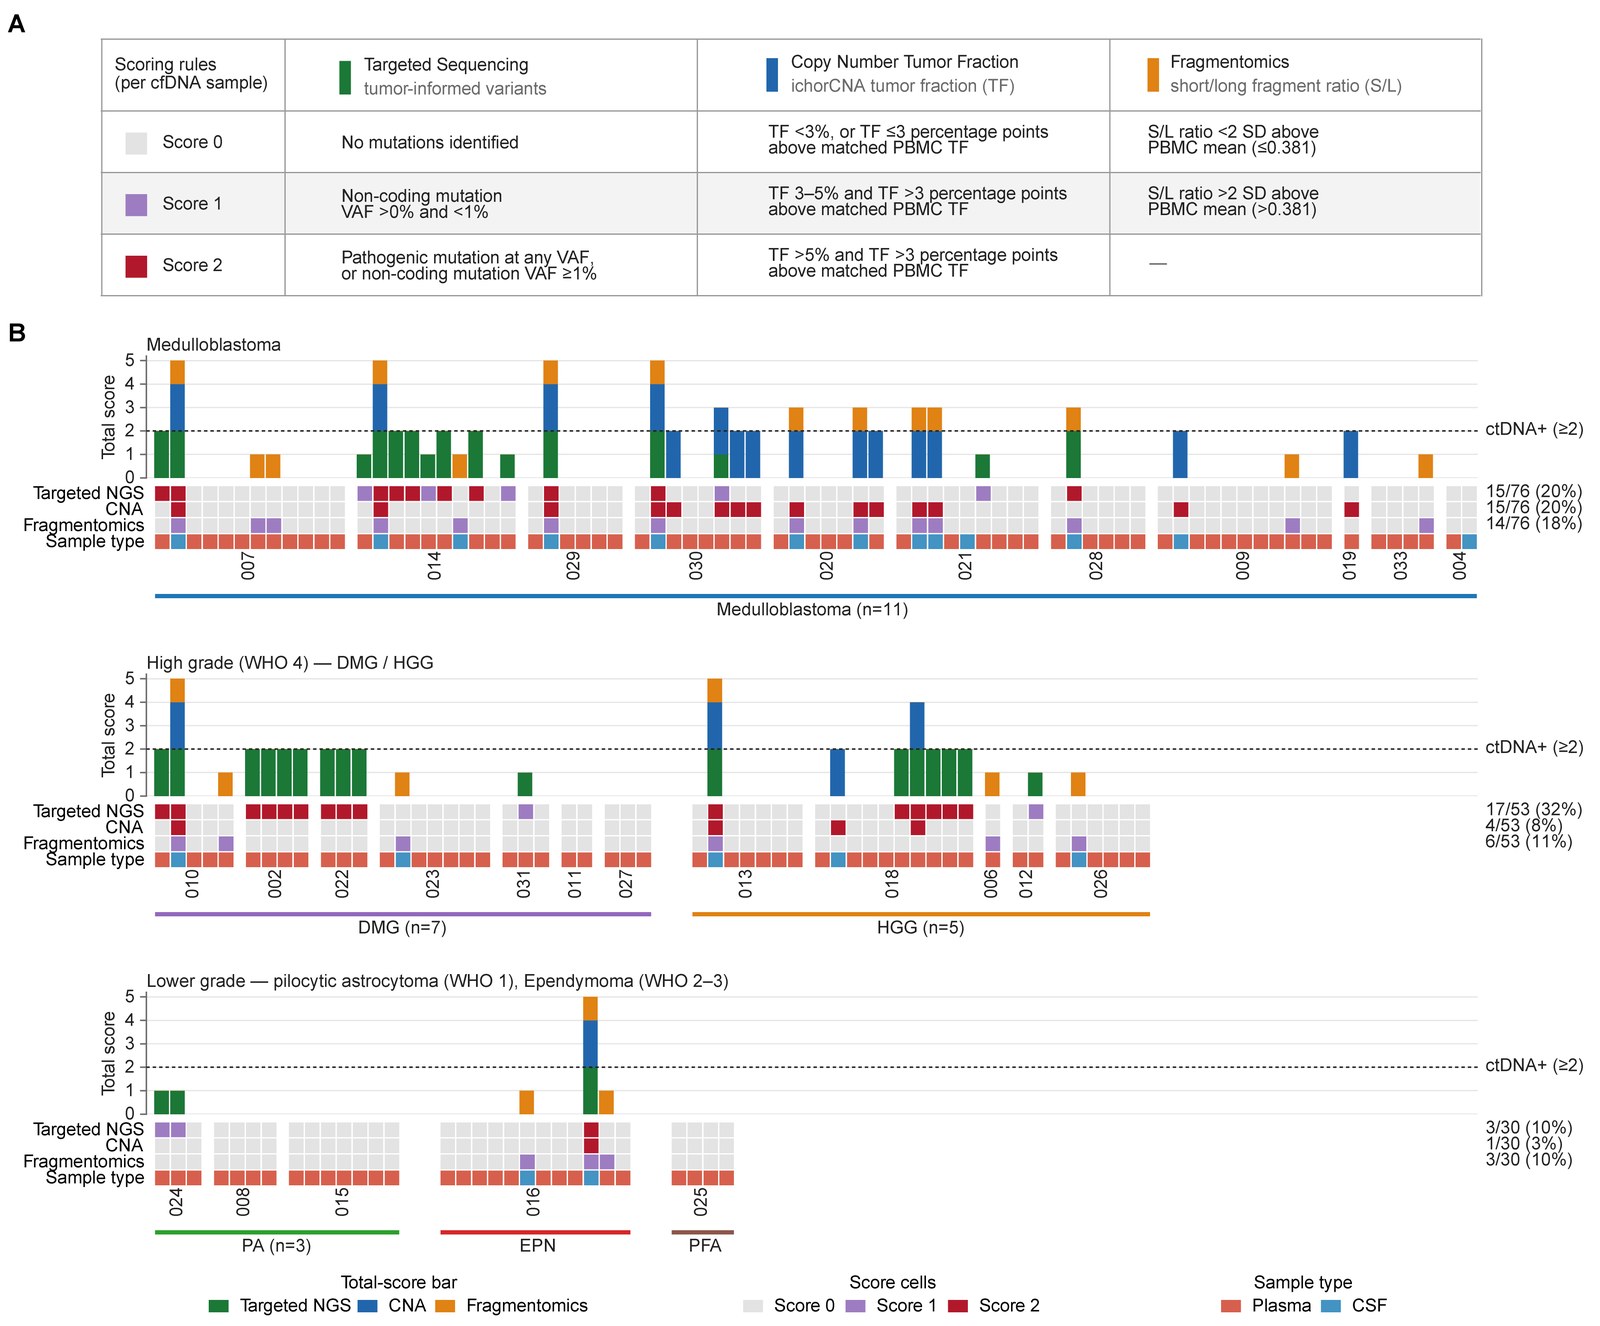
The three readouts together identified 38 ctDNA-positive samples out of 159. Mutations alone identified 26, and copy number alone identified 20. Two children with medulloblastoma had no mutations we could follow, and in both, copy number profiling detected ctDNA in later samples. Fragment size did not add positive samples on its own, but it often confirmed a call made by the other two readouts.
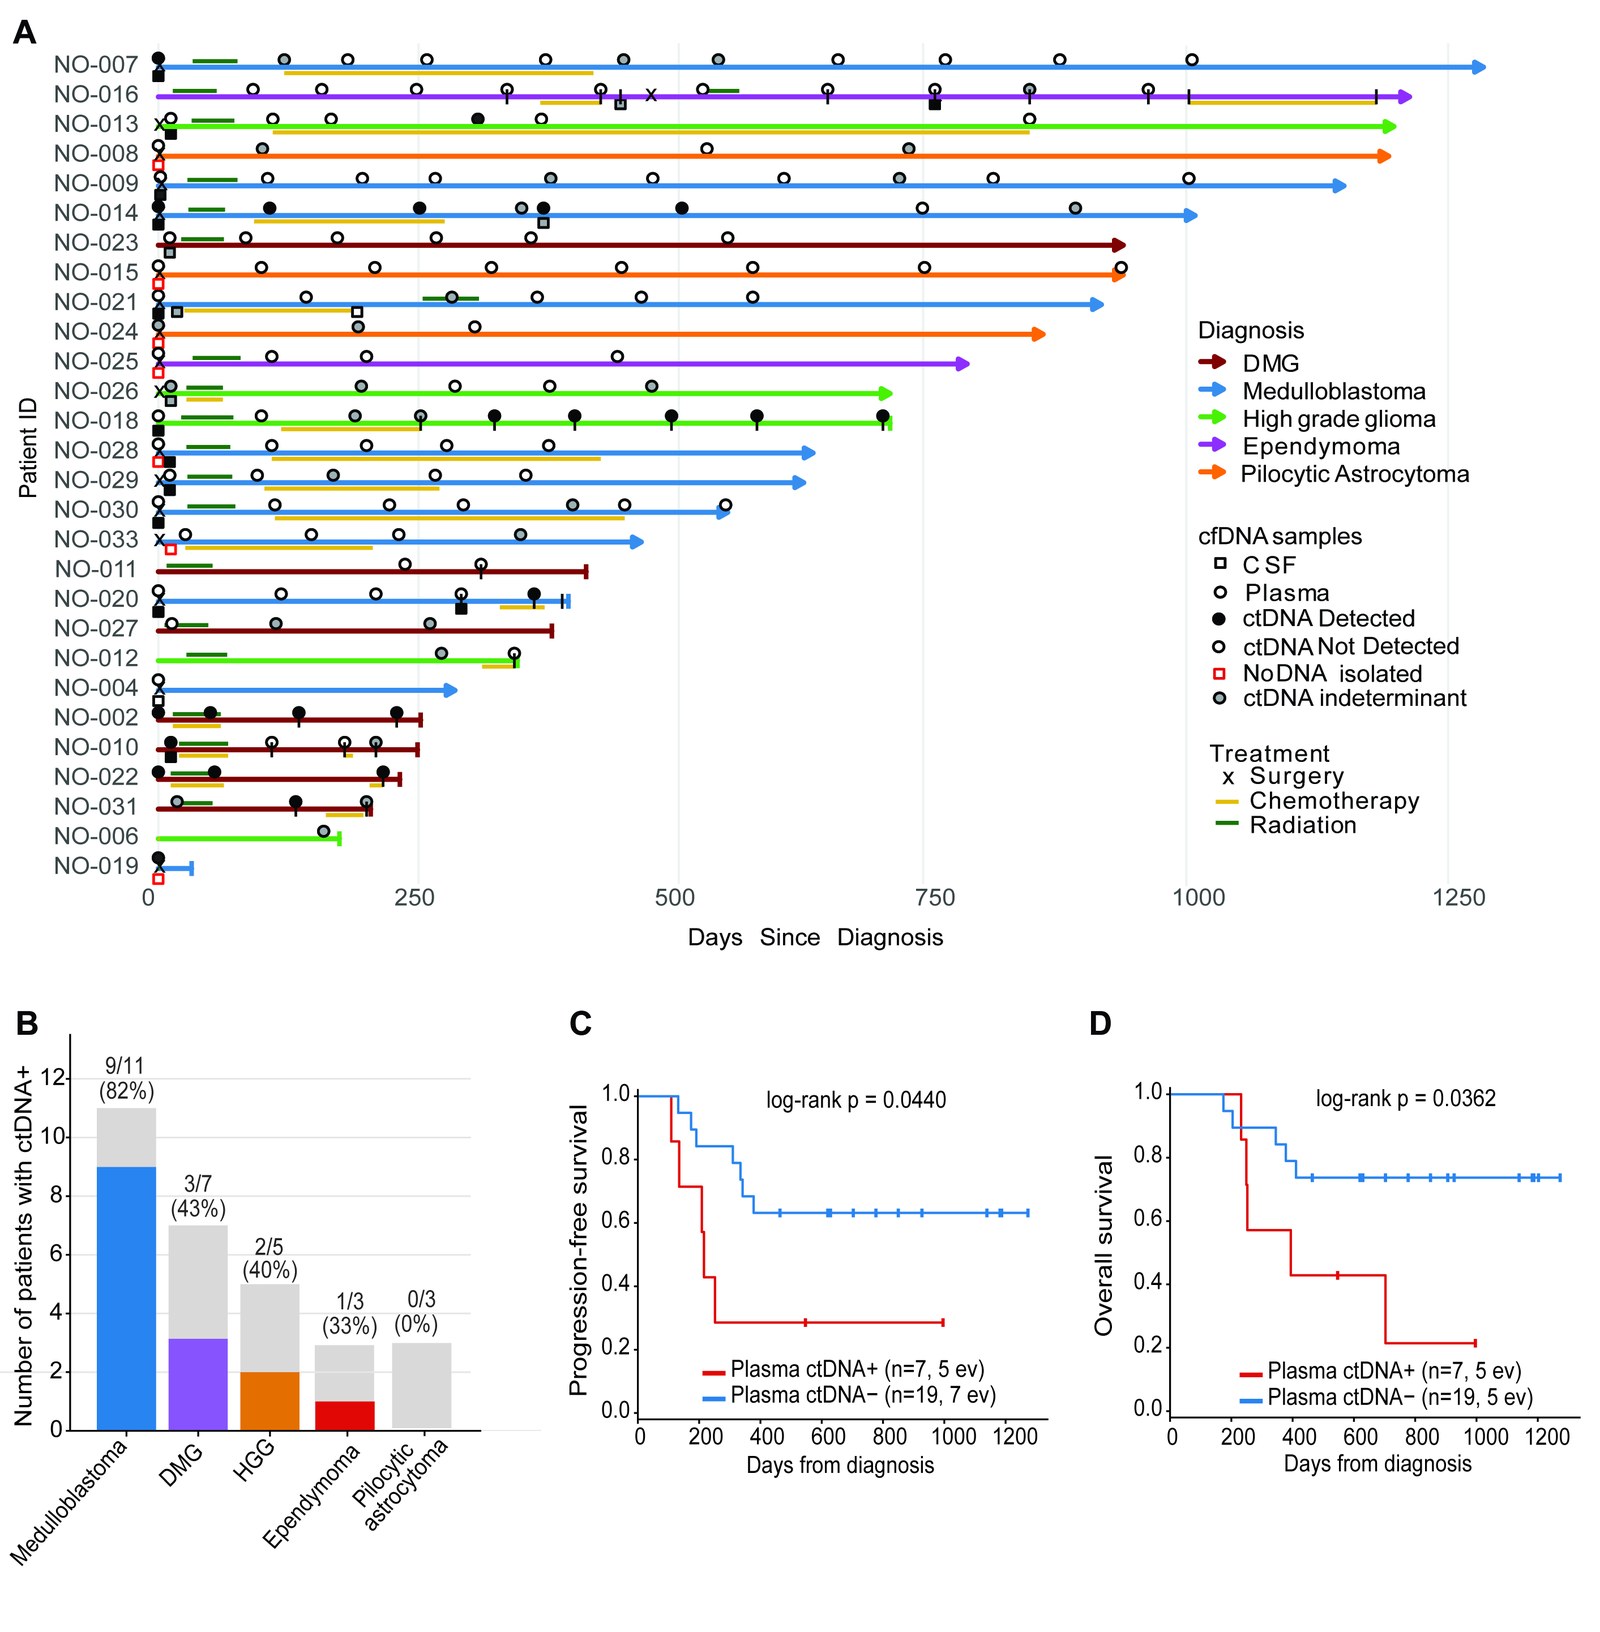
CSF was the more sensitive fluid. We detected ctDNA in 70% of CSF samples and in 17% of plasma samples. Plasma is far easier to collect at routine visits, however, and it still carried prognostic information. Children with ctDNA-positive plasma after diagnosis had shorter progression-free survival (hazard ratio 4.5 after adjusting for tumor type) and shorter overall survival, although the overall survival association weakened after adjustment.
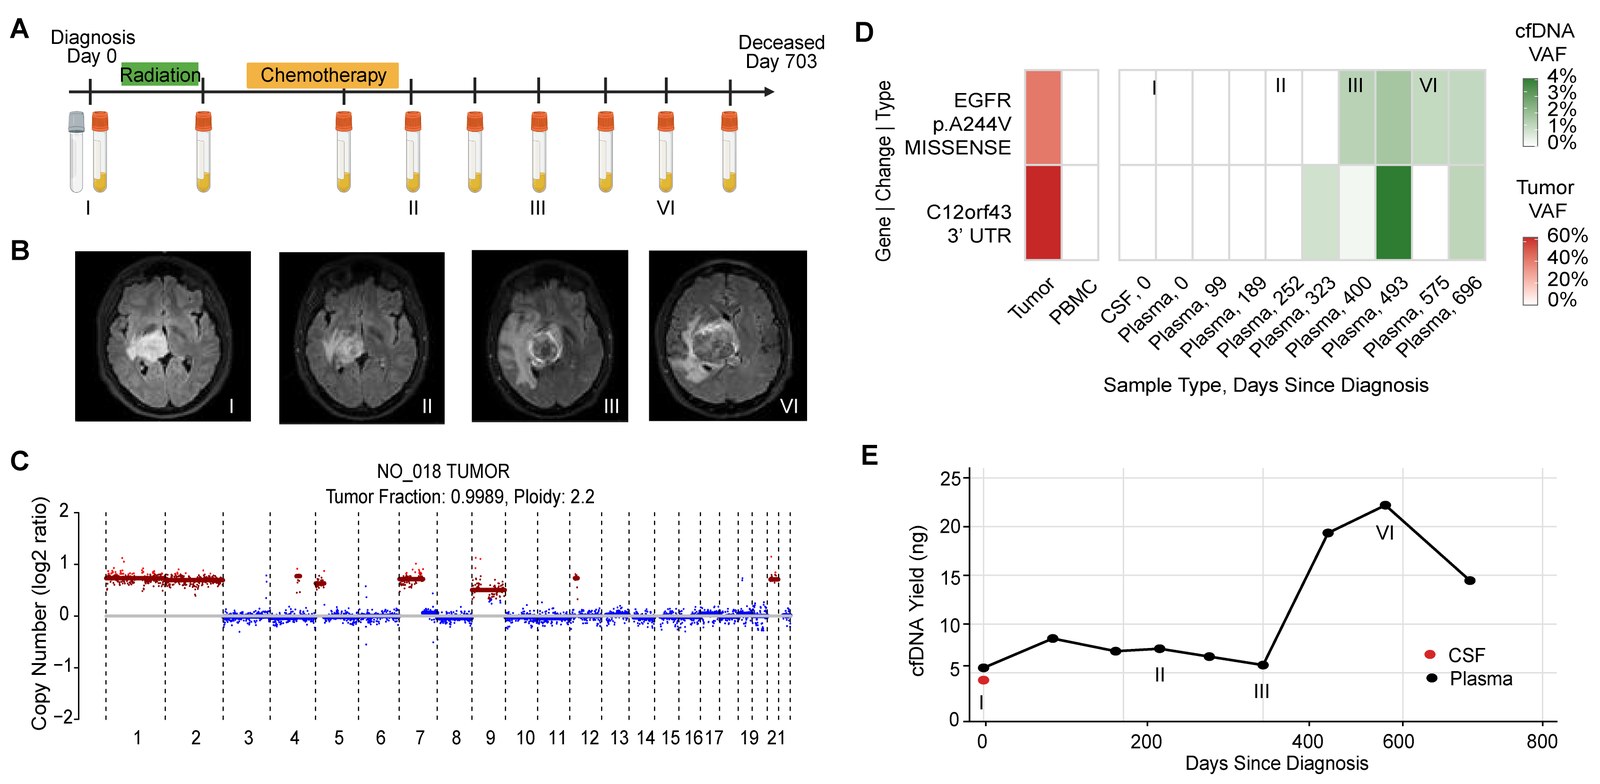
Two patients show what serial sampling can add. In a patient with a thalamic high-grade glioma, tumor variants were absent from plasma during radiation and targeted therapy. They appeared as the tumor progressed on MRI, together with a rise in total cfDNA yield.
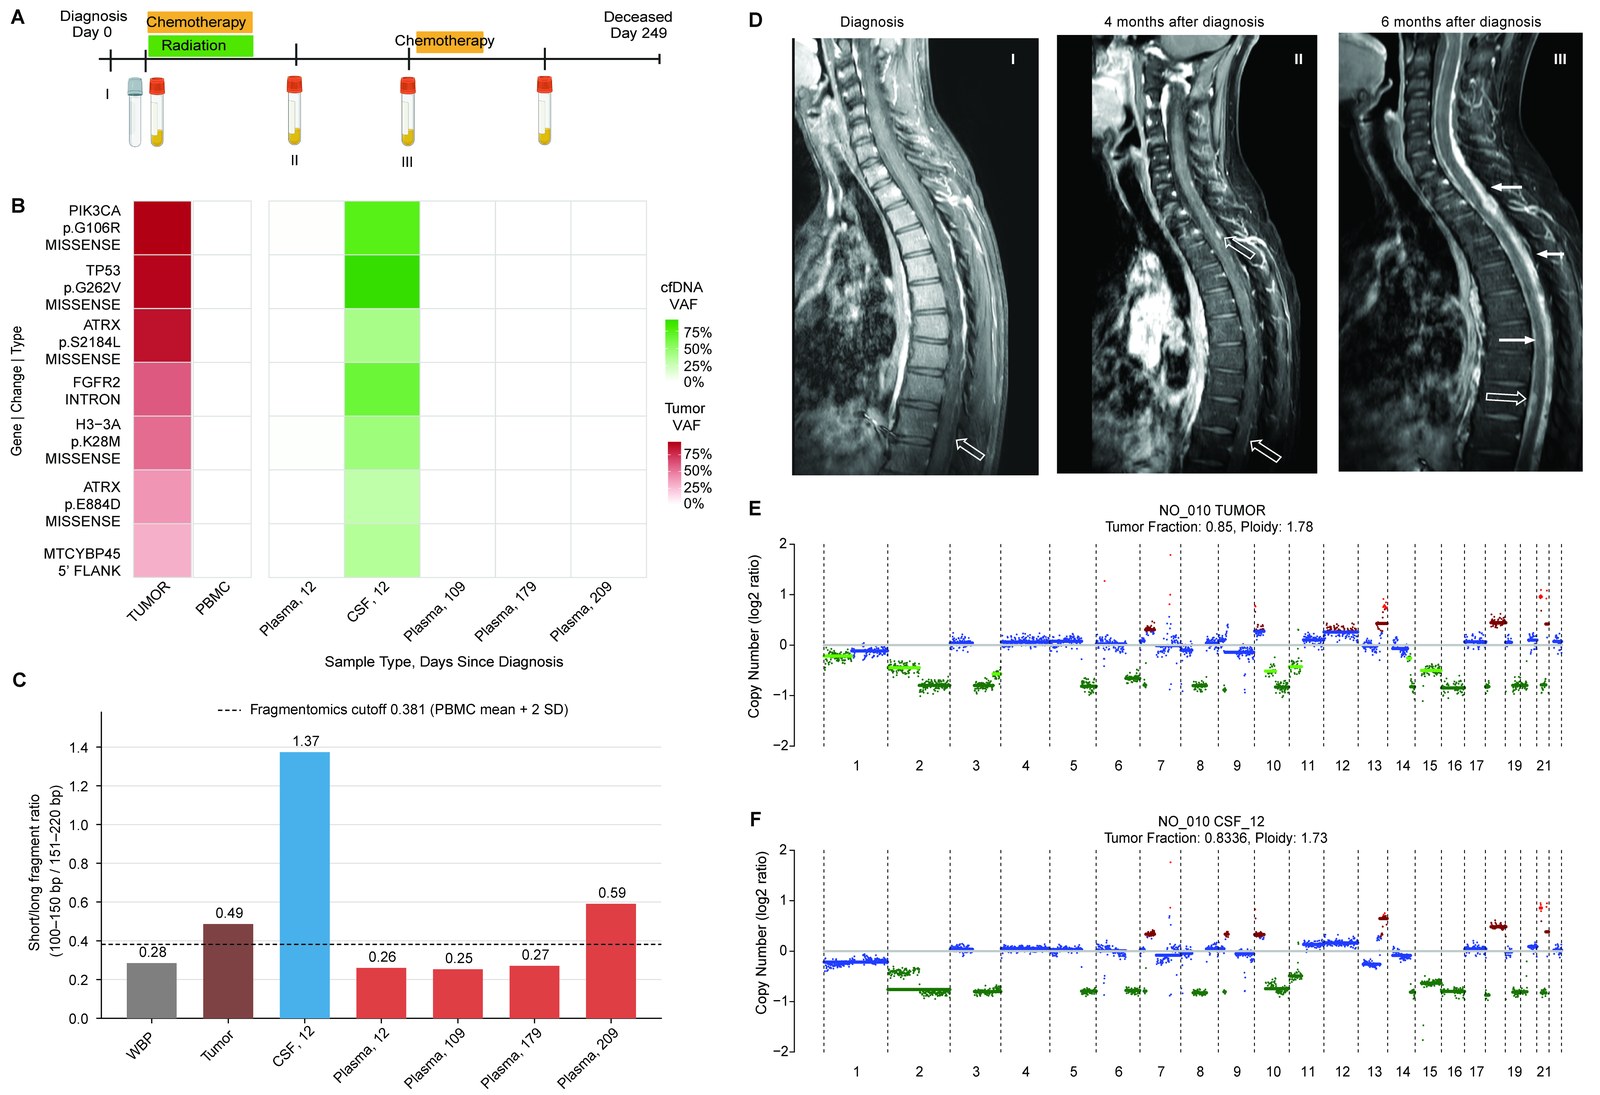
In a patient with diffuse midline glioma, CSF taken shortly after diagnosis carried the tumor’s mutations and its copy number profile. Plasma stayed negative until the fragment size signal rose late in the disease course, when leptomeningeal spread was visible on spinal MRI.
Together: combining mutations, copy number and fragment size detects more ctDNA than any one of them, CSF remains the most sensitive fluid, and plasma ctDNA after diagnosis identifies children at higher risk of progression. This is a pilot cohort from a single center, and we defined the thresholds within it. Our next step is prospective validation in larger, multi-institutional cohorts.
Huge credit to Shea and Sharvari for leading this work, and to Ross Mangum, who co-supervised it from Phoenix Children’s. We thank Adriana Marshall, Ben Posorske, Alyssa Hernandez, Lisa Keller, Shari Kyman, Kazuhiro Sabet, Patricia Cornejo, Tania Contente-Cuomo, Jonathan Keats, Peter Chiarelli, Jason Hauptman and Michael Berens, and above all the patients and families who took part. This research was supported by the Ivy Foundation and Students Supporting Brain Tumor Research, and sequencing was performed in the TGen Collaborative Sequencing Center.
Read more: the paper · the preprint on bioRxiv